ProductDashboards, assistant, maps
ComplaintBI
Complaint analytics platform for teams that need a clear view of complaint activity, reporting, assistant chat, and map-based analysis.
- Dashboards
- Insight highlights
- Assistant
- Reporting
- Maps
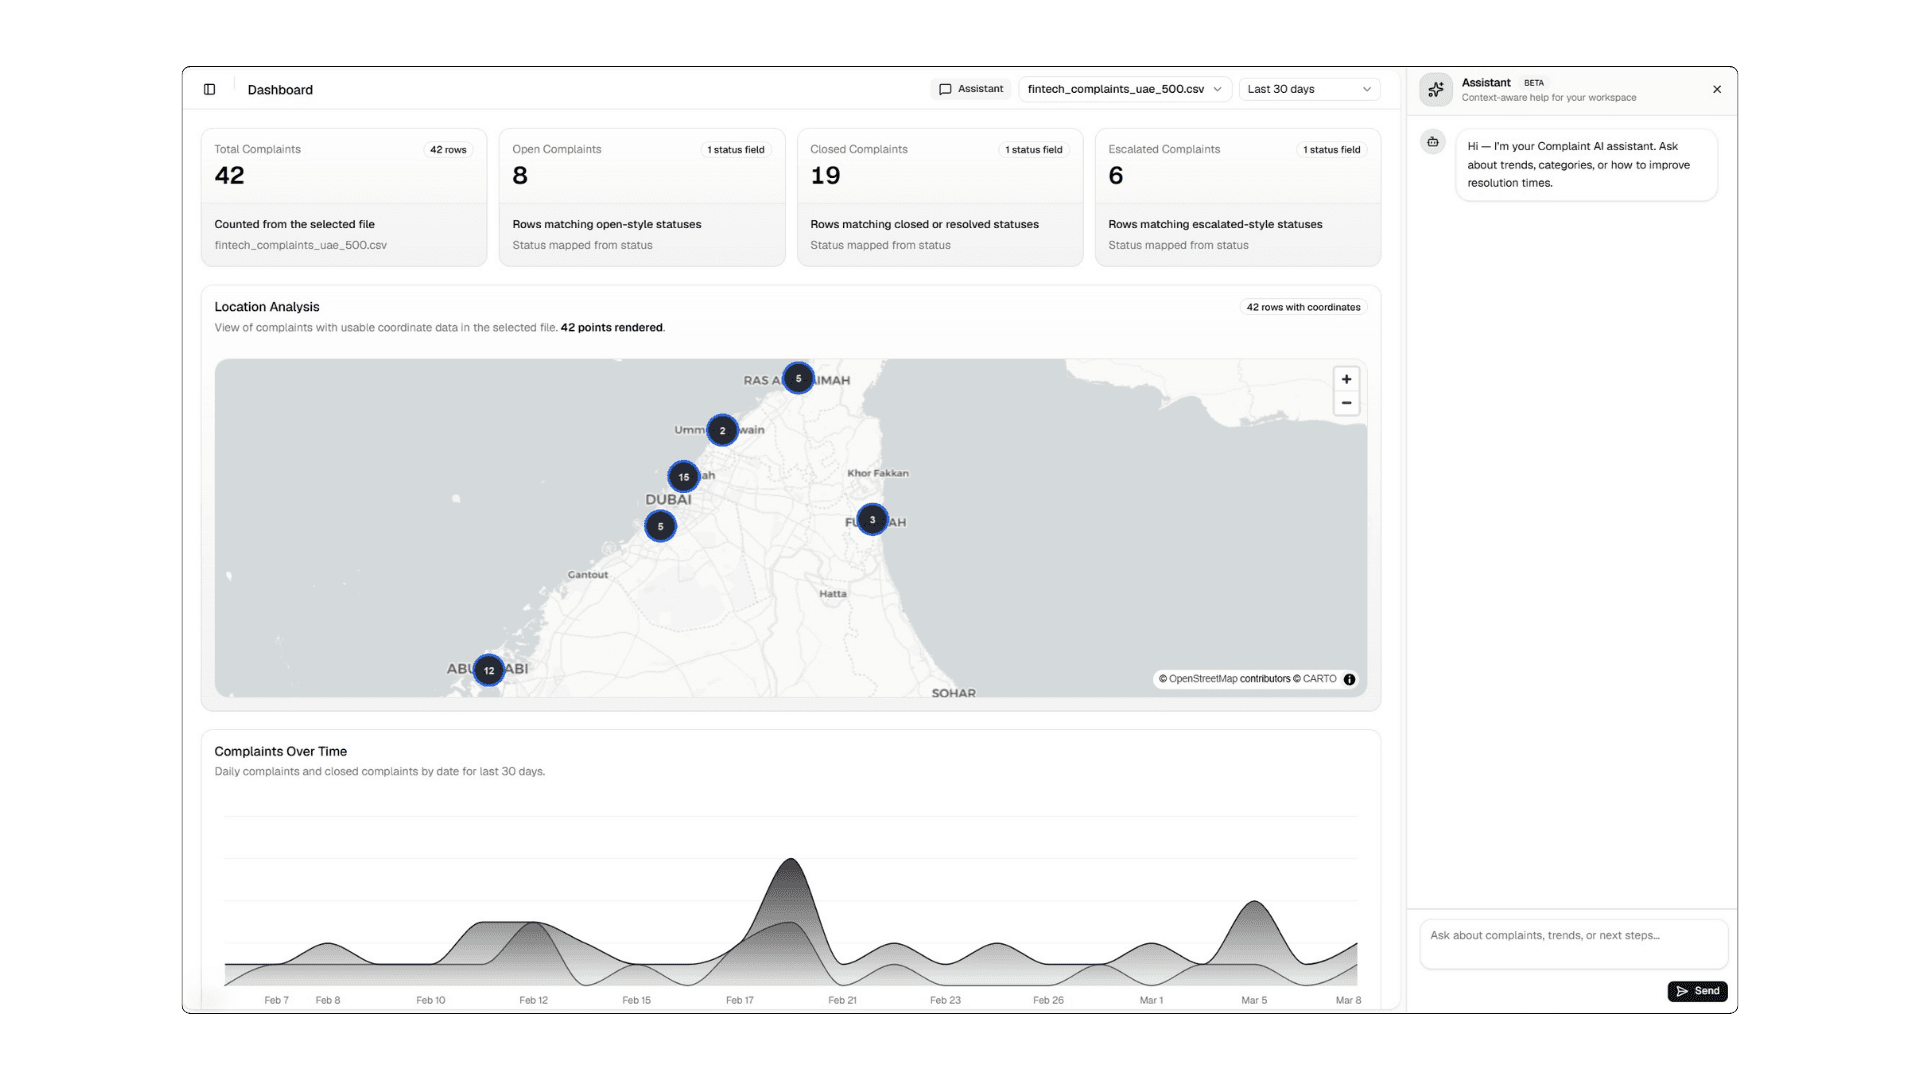
Complaint analytics in one place
ComplaintBI brings complaint data into a single analytics experience. Teams can review dashboard summaries, follow trends over time, generate reports, ask follow-up questions in natural language, and examine complaint distribution through map-based views.
Capabilities
Core capabilities designed to help teams monitor complaint activity, review patterns, and share findings.
Dashboards
Dashboard views for complaint volume, status, trends, and category-level breakdowns in a format that is easy to review and share.
Useful for teams that want a clear operational view without stitching together separate reports.
Insight highlights
Summaries that help surface notable changes, patterns, and areas that may need closer review.
Adds context to the dashboard so teams can move from observation to follow-up more quickly.
Assistant
Conversational access to complaint data for teams that prefer asking questions in plain language.
Supports follow-up questions and faster exploration of the same underlying data.
Reporting
Report generation for teams that need to package findings, circulate updates, or keep records outside the live dashboard.
Keeps reporting aligned with the same data used in day-to-day review.
Maps
Geographic views that help teams understand where complaints are concentrated and how activity is distributed across locations.
Helpful for operations that need both complaint context and location context in the same product.